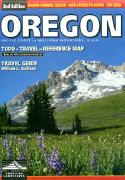
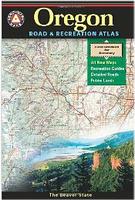
Oregon Road and Recreation Atlas. 1:225,000. Benchmark Maps.
Oregonians love their state, and they love this atlas. They rave about how clearly it shows the roads - all of them - and its accuracy, page overlap, and how easy it is to find landmarks. The Landscape Maps in the latest edition are dramatically improved, with better terrain clarity and detail. A Hunting and Fishing section has been added, along with a thorough updating of recreation information.
Sample detail from the Oregon recreation atlas.
$29.95
62-89482
Atlas
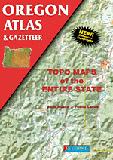
Oregon Atlas and Gazetteer. 1:150,000. DeLorme.
Excellent road atlas with topographic maps and gazetteer. The atlas has numerous pages of outdoor recreation information from campgrounds to state parks to horse trails, and much more. Softcover, 88 pages.
$29.95
62-8948
Atlas
Oregon Road Maps - Paper Maps
Oregon Road Map. 1:750,000. Imus Geographics.
This is the most detailed and illustrative single-sheet map ever made of Oregon. It shows 1536 towns and localities....more than any other map of the state. Extensive tourist information is shown on the reverse of the map. Size is 39.6 x 27.1 inches. Note that the flat and laminated editions are printed on heavier poster-weight paper.
Oregon map sample Image of the entire Oregon map Image of the entire reverse side of the Oregon map
$19.95
62-89904R
1 sheet, flat.
$29.99
62-89904L
1 sheet, laminated.
Oregon Road and Recreation Map. 1:800,000. Benchmark Maps.
The Oregon Recreation Map was created for outdoor lovers who want the high quality recreation information in the Benchmark atlases but with the convenience of a traditional folding map. Complete public lands detail and hunting unit boundaries are shown as well as categorized recreation listings. It's an extremely complete map of Oregon.
Sample detail from the Oregon recreation map.
$7.95
62-89908
1 sheet, folded
Oregon Road Map. Rand McNally.
A detailed traditional road map of Oregon by world-famous Rand McNally. The map features clearly labeled Interstate, U.S., state, and county highways; parks, points of interest, airports, county boundaries, and more; mileage and driving times map; and a detailed index. The map has small inset maps of Corvallis, Crater Lake National Park, Eugene, Medford, Portland & Vicinity, Downtown Portland, and Salem.
$7.99
62-8990
Oregon Road Map. (Rand McNally).
Oregon Large-print Road Map. GM Johnson.
Detailed road map of Oregon, with slightly larger type than other Oregon road maps.
$5.95
62-89909
1 sheet, folded
Oregon & Washington Road Map. Universal Map.
The Oregon and Washington fold map is a full-color, regional map, including: Eugene, Medford, Portland, and Salem, in Oregon; and Bellingham, Kennewick, Olympia, Seattle, Spokane, and Yakima, in Washington; and features: Airports, Campgrounds, Crater Lake National Park, Interstate Exit Numbers, Longitude and Latitude information, the Lower Columbia River Valley, Mount Rainier National Park, Parks and Rec Areas, Places of Interest, and Scenic Routes.
Laminated Oregon Pearl Road Map - Laminated Map. GM Johnson.
A waterproof folded road map of Oregon. The map has insets of Porland, Salem, and Eugene. Large enough to have good detail, small enough for easy use while travelling in a car.
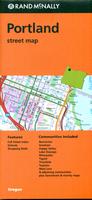
Portland Street Map - Paper Map. Rand McNally.
Detailed street map of Portland by the world-famous Rand McNally. The map also covers Fairview, Gresham, Johnson City, Lake Oswego, Milwaukie, Tigard, and Troutdale. Map size is 28 x 40 inches unfolded.
Sample detail from Portland street map.
$6.99
62-8992P
1 sheet, folded.
Portland Street Map - Paper Map. GM Johnson.
This detailed city street map also covers Beaverton, Gresham, Happy Valley, Lake Oswego, Tigard, West Linn, & Adjoining Communities.
$5.95
62-8992PPG
1 sheet, folded.
Highways of Portland & Vicinity Street Map - Paper Map. Rand McNally.
This regional map covers more area than the Portland maps above, but has less detail. This map also covers Albany, Corvallis, Eugene, Hillsboro, Lebanon, Longview, Salem, Springfield, Vancouver, and Washougal. Map size is 28 x 40 inches unfolded.
$5.99
62-8992POS
1 sheet, folded.
Portland Regional Street Map - Paper Map. GM Johnson.
This map covers from Mt. St. Helens in the north, to Mt. Hood in the east, and to Eugene in the south.
Astoria/Seaside/Cannon Beach city map. 1:25,000. 2005. (Pittmon).
$5.95
62-8992BEA
Beaverton City Map. (GM Johnson).
$4.95
62-8992BE
Beaverton/Hillsboro/Forest Grove city map. 1:40,000. 2007. (Pittmon).
$4.95
62-8992BEN
Bend/Redmond/Sisters city map. 1:29,000. 2006. (Pittmon).
$5.95
62-8992BED
Bend/Redmond/Prineville city map. (GM Johnson).
$4.95
62-8992BR
Brookings/Gold Beach city map. Variable scales. (Pittmon).
$4.95
62-8992CL
Clackamas County map. 1:120,000. 2007. (Pittmon).
$4.95
62-8992COO
Coos Bay/North Bend city map. 1:19,000. (Pittmon).
$4.95
62-8992COR
Corvallis city map. (Pittmon).
$5.95
62-8992COV
Corvallis city map. (GM Johnson).
$4.95
62-8992DE
Deschutes County map. 1:165,000. 2007. (Pittmon).
$3.95
62-8992DO
Douglas County map. 1:100,000. 1998 (Pittmon)..
$5.95
62-8992EUG
Eugene/Springfield City Map. (GM Johnson).
$2.95
62-8992GRA
Grant County map. 1:100,000. 1991. (Pittmon).
$3.95
62-8992GRB
Grants Pass city map. 1:23,000. 1997. (Pittmon).
$3.95
62-8992GRE
Gresham city map. 1:40,000. 2005. (Pittmon).
$3.95
62-8992HA
Harney County map. 1:225,000. 1997. (Pittmon).
$3.95
62-9992WB
Hermiston, OR & Walla Walla, WA street map. (GM Johnson).
$3.5
62-8992HER
Hermiston city map. 1:16,000. No date. (Pittmon).
$5.95
62-8992TDA
Hood River & The Dalles city map. (GM Johnson).
$3.5
62-8992HO
Hood River city map. 1:15,000. 1991. (Pittmon).
$4.95
62-8992KL
Klamath Falls city map. 1:27,000. 2006. (Pittmon).
$5.95
62-8992KLA
Klamath Falls city map. (GM Johnson).
$4.95
62-8992LA
La Grande city map. (GM Johnson).
$3.95
62-8992LAG
La Grande city map. 1:16,000. 1995 (Pittmon)..
$4.95
62-8992LAP
La Pine city map. 1:31,800. 2008. (Pittmon).
$3.95
62-8992LAK
Lake County map. 1:240,000. 1991. (Pittmon).
$3.95
62-8992LAN
Lane County map. 1:170,000. 2004. (Pittmon).
$3.95
62-8992LE
Lebanon/Sweet Home city map. 1:20,000. 2000. (Pittmon).
$3.5
62-8992MA
Malheur County map. 1:220,000. 1991. (Pittmon).
$4.95
62-8992MC
McMinnville street map. (GM Johnson).
$5.95
62-8992MEF
Medford/Ashland street map. (GM Johnson).
$3.5
62-8992MU
Multnomah County map. 1:115,000. No date (Pittmon)..
$4.95
62-8992NEWB
Newberg/McMinnville city and Yamhill County map. 1:36,000. 2006. (Pittmon).
$4.95
62-8992NEWP
Newport/Lincoln City and Lincoln County map. 1:20,000. 2010. (Pittmon).
$5.95
62-8992NC
North Coast Cities street map. (GM Johnson).
$3.5
62-8992OR
Oregon City map. 1:45,000. 1995. (Pittmon).
$3.95
62-8992POL
Polk County map. 1:110,000. No date (Pittmon)..
$3.95
62-8992PR
Prineville/Madras city and Crook County map. 1:15,000. 2000. (Pittmon).
$4.95
62-8992RO
Roseburg city and Douglas County map. 1:17,000. 2008. (Pittmon).
$6.95
62-8992S
Salem City Map. (Rand McNally).
$4.95
62-8992SA
Salem city map. 1:31,000. 2008. (Pittmon).
$3.5
62-8992SH
Sherman County map. 1:115,000. No date. (Pittmon).
$5.95
62-8992SC
South Coast Cities street map. (GM Johnson).
$4.95
62-8992ST
St. Helens/Scappoose city and Columbia County map. Variable scale. 2009. (Pittmon).
$3.95
62-8992TH
The Dalles city map. 1:17,000. No date. (Pittmon).
$3.95
62-8992TI
Tigard/Lake Oswego/Wilsonville city map. 1:44,000. No date. (Pittmon).
$3.95
62-8992TIL
Tillamook and Rockaway Beach city map. 1:15,000. 1992. (Pittmon).
$3.95
62-8992WAL
Wallowa County map. 1:190,000. 1990. (Pittmon).
$3.95
62-8992WAS
Washington County map. (Pittmon).
$3.95
62-8992WH
Wheeler County map. 1:140,000. 1992. (Pittmon).
$3.95
62-8992WO
Woodburn city and Marion County map. 1:12,000. 2003. (Pittmon).
Oregon City Maps - Laminated Maps
Laminated Portland Pearl® Street Map- Laminated Map. 1:32,000. GM Johnson.
Detailed, laminated, city-center street map of Portland. The map, smaller than the paper maps listed above, is ideal for tourists walking around the city, or for use in a car. With a small Portland and Vicinity map on the reverse. 4 x 11" folded, 11 x 24" when unfolded.
Sample detail of the Portland Pearl street map.
$6.95
62-8992POP
1 sheet, folded.
Laminated Oregon City Maps, other than Portland - Laminated Maps. GM Johnson.
Detailed, laminated, city-center street maps of major Oregon cities. The maps, smaller than the paper maps listed above, are ideal for tourists walking around the cities, or for use in a car. The maps include an index.
Sample detail of the Medford Pearl street map.
$7.95
62-89921EU
Eugene & Springfield laminated city map. 1:32,000. 4 x 11" folded, 11 x 24" when unfolded.
$6.95
62-89921ME
Medford & Ashland laminated city map. 1:32,000. 4 x 11" folded, 11 x 24" when unfolded.
$6.95
62-89921SA
Salem & Keizer laminated city map. 1:32,000. 4 x 11" folded, 11 x 24" when unfolded.
Bend and Central Oregon Street Atlas. 1:29,000. (Pittmon). Black/white. 107 pages, spiralbound.
$19.95
62-8992MI
Corvallis/Albany/Lebanon and the Mid-Willamette Valley Street Atlas. 1:,000. (Pittmon). Black/white. 109 pages, spiralbound.
$19.95
62-8992EU
Eugene and Lane County Street Atlas. 1:23,000. (Pittmon). Black/white. 124 pages, spiralbound.
$19.95
62-8992MED
Medford Street Atlas. 1:22,000. Pittmon, 2007. Black/white. 112 pages, spiralbound.
$13.95
62-8992PA
Portland Street Atlas. Softcover, center-stapled. (GM Johnson).
$21.95
62-8992SAL
Salem and Marion County Street Atlas. Variable scale. (Pittmon). Black/white. 97 pages, spiralbound.
$7.99
62-8992WE
Western Oregon Cities Atlas. Center-stapled pocket atlas. Covers Astoria, Corvallis, Grants Pass, McMinnville, Medford, Salem, St. Helens, Woodburn. (Rand McNally).
Oregon City, County, and State Business Wall Maps
Oregon City Wall Maps.
When it comes to general planning, defining delivery areas, planning direct marketing and delivering products, our city wall maps are perfect to get the detailed information you need.
These maps offer clear mapping by showing all major streets and roads, but leaving out the smaller streets.
If you want a clear map for easy planning, then these are the maps for you; if you want a map showing every little back alley, these are not for you.
We offer wall maps for Beaverton, Bend, Eugene, Gresham, Hillsboro, Medford, Portland, Salem, and Springfield.
We offer state and county wall maps for all of the USA. The maps come in sizes from 24 x 36 to 108 x 144 inches. They are available in variety of mounting and framing options. The maps are ideal for business applications, sales territory, delivery planning, direct mail targeting and hundreds of other applications.
Oregon Bicycling Maps. Oregon is crossed by four very popular long-distance trail - each has a set of detailed cycling maps for that trail. The trails are the Pacific Coast Trail, the Lewis & Clark Trail, the Sierra Nevada Trail, and the TransAmerica Trail. We also have three single-sheet cycling maps of the state.
Crater Lake N.P. Hiking Map. 1:63,000. NGS/TI #244. Detailed hiking map of this spectacular park inside a volcano.
$14.95
63-2100-244
1 sheet, folded.
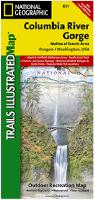
Columbia River Gorge Hiking Map. 1:75,000. NGS/TI #821. Considered one of the best year-round outdoor recreation areas in the country, the Columbia River Gorge contains countless opportunities for hikers, climbers, kayakers, cyclists, windsurfers, and winter sports enthusiasts alike. The 80 mile long gorge contains diverse ecosystems ranging from the lush Oneonta Gorge Rain Forest to the arid Celilo Grasslands.
Our detailed Trails Illustrated recreation map of the Columbia River Gorge contains carefully researched trails, campsites, forest service roads, and points-of-interests and adjoins our Mt. Hood map.
Backcountry users will find the UTM and Latitude/Longitude grids, mileage charts, and other accurate navigation features perfect for exploring the region confidently and safely.
Image of the front of the map. Image of the detail of the map.
$14.95
63-2100-821
1 sheet, folded.
Mt. Hood Hiking Map. 1:75,000. NGS/TI #820. Located just outside of Portland, Mt. Hood is the tallest peak in Oregon, the fourth highest in the Cascade Range, and a premier destination for outdoor enthusiasts. The mountain has six ski areas, the renowned Timberline Lodge located on the southern flank beside the Palmer Glacier, and is part of the 1.0M acre Mt. Hood National Forest.
Our detailed Trails Illustrated recreation map of Mt. Hood contains carefully researched trails, campsites, forest service roads, and points-of-interests.
Backcountry users will find the UTM and Latitude/Longitude grids, mileage charts, and other accurate navigation features perfect for exploring the region confidently and safely.
Image of the front of the map. Image of the detail of the map.
$14.95
63-2100-820
1 sheet, folded.
Recreation and road maps of Oregon. Great Pacific Recreation & Road Maps Co. GPR's up-to-date highly legible maps provide you with unmatched detail. Each map is cross-referenced to comprehensive easy-to-read text.
Full-color, easy to read
1,200 to 1,500 destinations pinpointed per map!
Detailed Base Maps - Large scale and easy to use. Ideal for understanding the "big picture." Color coded for easy reading. Maps depict a full range of recreation destinations and activities: trails, parks, campgrounds, recreation areas, museums & historic places, golf courses, wineries & microbreweries, markets & malls, sports & performing arts venues ... and much more. Ideal for daytrippers, bicyclists & explorers!
Highly Detailed City Inset Maps - Ideal for exploring by car or bicycle. Recreation destinations, local landmarks, bicycle & hiking trails, freeway exits & more.
Super-Detailed Walking Scale Maps - Ideal for exploring Downtowns and neighborhoods.
Comprehensive Recreation Index - Detailed recreational indexing; clear and easy to use. City locations, populations, elevations, visitor info phone numbers and websites, transit info & more.
Cross-Referenced Text - Many maps feature detailed recreational listings keyed to map.
$6.95
62-89910
Oregon & Northern California Coast Recreation Map. 1 sheet, folded.
$7.95
62-99906
Oregon & Washington Coast Recreation Map. 1 sheet, folded.
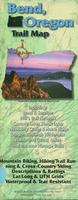
Waterproof! Bend Area Trail Map. 1:63,360 & 1:47,520. Adventure Maps.
The Bend Oregon Adventure Map is a waterproof, topographic map (lat/long,UTM grids) that includes route descriptions covering the Bend area including, Sunriver, Phils Trail Network, Cascade Lakes Scenic Loop, Newberry Crater & Horse Ridge, Oregon Badlands Wilderness, Waldo and Cultus Lakes, and the new Wanoga Trails. It includes 26 of the best mountain biking ride suggestions, 9 hiking & trail running suggestions, as well as 6 nordic ski/snowshoe area suggestions.
Sample detail from the Bend Area Trail Map.
$11.99
62-8971-BT
1 sheet, folded
Waterproof! Central Oregon Road Cycling Map & Guide. 1:100,000. Adventure Maps. The Bend, Central Oregon Road Biking Map & Guide is a waterproof, topographic map that includes detailed road biking information for Bend, Sisters and all of Central Oregon.
A variety of paved local, rural and forest roads create almost limitless opportunities for road biking and touring in Central Oregon. A variety of terrain ranging from alpine settings to vast forests to farm and rangeland allows for a wide range of scenery and ride difficulties. This map details 32 popular rides in the area with descriptions and elevation profiles as well as accurately showing roads and landmarks and a variety of other useful information. Size is 27 x 39 inches.
Sample detail from the Central Oregon Cycling Map.
$11.99
62-8971-CC
1 sheet, folded
Waterproof! Hood River Mountain Biking Map. 1:31,680. Adventure Maps. The Hood River, Oregon Mountain Biking and Hiking Adventure Map is a waterproof, topographic map that includes a mountain biking route guide for trails in the Columbia Gorge and Mt St Helens areas. This map provides full beta for mountain biking, hiking and jogging trails in the Surveyor's Ridge and Post Canyon Trail Systems. It also includes detailed map and route descriptions for mountain biking, hiking and trail running trails throughout the Deschutes River Ride, the Klickitat Rail Trail, Falls Creek, the Lewis River Trail and Mount St. Helens. Size is 27 x 39 inches.
Sample detail from the Hood River Mountain Biking Map.
$11.99
62-8971-HO
1 sheet, folded
Waterproof! Mt. Hood Area Hiking, Riding, and Climbing Map. 1:31,680. Adventure Maps. The map includes mountain biking, hiking and climbing descriptions and covers Mt. Hood, Mt. Hood Wilderness, Salmon-Huckleberry Wilderness, Badger Creek Wilderness, Roaring River Wilderness, Surveyors Ridge, Lookout Mountain, Timothy Lake and Sandy Ridge Trails.
Forests of huge old growth trees, lush undergrowth, clear mountain streams and the high alpine environment of Mt. Hood highlight this beautiful corner of Oregon. Routes range from easy roadbeds to remote backcountry trails with steep grades and technical challenges. Use this map to travel safely in this diverse landscape.
Mountain Bikers, hikers and equestrians will find hundreds of miles of trails on this map suitable for a wide range of skill and fitness levels. In addition, the 20 ride and 18 hike descriptions highlight some of the best trails. Ratings for time, mileage, aerobic and technical difficulty as well and other valuable information eliminate some of the guesswork in picking a ride or hike. Size is 27 x 39 inches.
Sample detail from the Mt. Hood Trail Map.
$11.99
62-8971-MH
1 sheet, folded
Waterproof! Northwest Coast Trail Map. 1:126,720 & 1:31,680 Adventure Maps.
The NW Coast Trail Map & Guide is a waterproof, topographic (lat/long,UTM grids) trail map that includes route descriptions for the North Oregon Coast and Mountains as well as the South Washington Coast. It includes 15 hike and 5 road bike suggestions. The map depicts put-ins for paddlers, points for birding/wildlife viewing as well as a designated OHV area.
Sample detail from the Northwest Coast Trail Map.
$11.99
62-8971-NWC
1 sheet, folded
Waterproof! Oakridge Trail Map. 1:48,000. Adventure Maps. The mountains and forests around Oakridge on the western slopes of the Cascades Range in the heart of Oregon, are criss-crossed with a seemingly endless network of trails for mountain bikers, hikers, and horeseback riders. Many trails wind through a landscape dominated by awe-inspiring old-growth forest. Size is 27 x 39 inches.
Sample detail from the Oakridge Trail Map.
$11.99
62-8971-OA
1 sheet, folded
Waterproof! Sisters & Redmond Trail Map. 1:23,760; 1:31,680; 1:63,360. Adventure Maps.
The Sisters & Redmond High Desert Adventure Map is a waterproof, topographic (lat/long,UTM grids) trail map that includes hiking and mountain bike route descriptions covering the areas of Sisters and Redmond as well as The Mckenzie River Trail, Camp Sherman, Santiam Pass, Lookout Mountain, Round Mountain, Smith Rock, Gray Butte, Maston, Alder Springs, Otter Bench, Scout Camp, OLeary Trail, King Castle Trail. The map includes details for 17 of the best mountain bike rides, 15 hikes, and 5 X/C ski routes. Some of the mountain bike routes and hikes are denoted as well with a trail running symbol as they will provide enjoyment to runners. The map includes a blowup of Smith Rock and the Peterson Ridge Trails. Rock Climbers, Equestrians and Fishermen will also find this map very useful as it accurately shows all streams, lakes, roads, OHV routes and land ownership boundaries.
Sample detail from the Sisters and Redmond Trail Map.
$11.99
62-8971-RED
1 sheet, folded
Waterproof! Three Sisters Wilderness Trail Map. 1:63,360 & 1:31,680. Adventure Maps.
The Three Sisters Wilderness Adventure Map is a waterproof, topographic (lat/long,UTM grids) map that includes route descriptions for trails in the Three Sisters Wilderness and Mount Washington Wilderness areas in Oregon. It includes detailed descriptions for 20 of the areas best hikes. It also includes a blowup of the High Peaks. Fisherman, Equestrians, and Hunters will also find this map very useful as it accurately shows all streams, lakes, roads, and land ownership boundaries.
Sample detail from the Three Sisters Wilderness Trail Map.
$11.99
62-8971-THR
1 sheet, folded
Portland and Willamette Valley Road and Recreation Map. Various scales. Great Pacific Recreation Maps. Includes Mt. Hood and the Columbia River Gorge. This detailed map includes a regional map, 7 city maps, and extensive information on the wineries of the Willamette Valley, things to do and places to go, and much more. Folded, double-sided. ISBN 9780938011439.
Sample detail of the Portland and Willamette Valley Map
$6.95
62-8976
1 sheet, folded.
Oregon Wall Maps & Satellite Posters
Oregon State and County Wall Maps. Intelligent Direct.
We offer state and county wall maps for all of the USA. The maps come in sizes from 24 x 36 to 108 x 144 inches. They are available in variety of mounting and framing options. The maps are ideal for business applications, sales territory, delivery planning, direct mail targeting and hundreds of other applications.
Click here to order county wall maps and to see sample images, descriptions, and prices.
Click here to order state wall maps and to see sample images, descriptions, and prices.
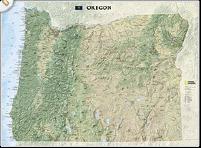
Oregon Wall Map. 1:1,185,000. National Geographic Maps.
Oregon's diverse terrain and vegetation is rendered accurately through the map's color palate, shaded relief, and ocean bathymetry. Inherent to National Geographic reference cartography, the state wall maps contain thousands of place names and precise locations of: cities, major roadways and railways, airports, federal and state protected lands, mountain ranges and prominent peaks, marine sanctuaries, military installations, major lakes, rivers and reservoirs, and other geographic features. Map size is 34 x 41".
Sample detail of the Oregon wall map Image of the Oregon wall map
Oregon Benchmark Paperweights, Lapel Pins, Magnets, and more
Benchmark Paperweights of Oregon locations. Geo-Situ.
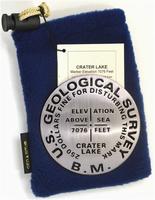
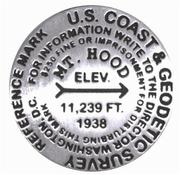
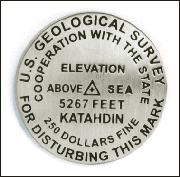
Each paperweight, measuring approximately 3-1/4" in diameter, are an authentic replica of famous elevation benchmarks around the world, are crafted from high quality pewter for years of tarnish-free use. Each paperweigh comes in its own small fleece bag for storage, along with a small tag giving a brief description of the geographic location. All are felt-bottomed for scratch-free use on any surface.
$59.95
62-8997CR
Crater Lake, Crater Lake National Park, OR paperweight. 7,076 ft.
$59.95
62-8997HO
Mt. Hood, OR paperweight. 11,239 ft.
$59.95
62-8997JE
Mt. Jefferson, Oregon paperweight. 10,497 ft., second highest peak in Oregon.
$59.95
62-8997MS
Mt. Scott, Crater Lake National Park, OR paperweight. 8,938 ft. The highest point in Crater Lake National Park.
$59.95
62-8997SN
North Sister peak, Oregon paperweight. 10,085 ft., Oregon.
South Sister peak, Oregon paperweight. 10,358 ft., Oregon.
Benchmark Lapel Pins. Geo-Situ.
These lapel pins, measuring approximately 7/8" across, replicate official USGS benchmarks located on the tops of major mountains in the US. These pins, made of high quality pewter, offer a unique reminder of one's climb towards the summit. Each pin comes with a brief description of the location, including such information as how the mountain got its name.
$11.95
62-8997CRL
Crater Lake, Crater Lake National Park, OR lapel pin. 7,076 ft.
$11.95
62-8997SNL
North Sister peak, Oregon lapel pin. 10,085 ft.
$11.95
62-8997SML
Middle Sister peak, Oregon lapel pin. 10,047 ft.
$11.95
62-8997SSL
South Sister peak, Oregon lapel pin. 10,358 ft.
Benchmark Magnets. 1-1/4-inch diameter benchmark magnets. Cast in fine pewter. Mounted on a small information card.
$12.95
62-8997CRM
Crater Lake, Crater Lake National Park, Oregon magnet. 7,076 ft.
$12.95
62-8997HOM
Mt. Hood, Oregon magnet. 11,239 ft.
$12.95
62-8997YAM
Yaquena Head Lighthouse, Oregon, magnet. 93 ft.
Oregon Geological and Thematic Maps
Map of Oregon Seismicity 1841-1986. 1:1,000,000. 1986. ODGMI (GMS-49). One sheet with discussion, table and bibliography. Size is 91 x 58 cm. In black and white.
$8.95
62-8915
1 sheet, folded
Earthquakes in Washington and Oregon: 1872-1993. USGS. The map (45.5 x 36.5") displays earthquakes that have occurred in or near Washington and Oregon during 1872 to 1993.
The epicenter symbol sizes are scaled into three magnitude categories: magnitudes 1.5-3.4, magnitudes 3.5-5.4, an magnitudes of 5.5 and greater.
The epicenter symbols are color-coded to indicate the time period when the earthquake occurred (1872-1969 or 1970-1993).
The symbols are also color coded to indicate the plage (North American or Juan de Fuca) in which the earthquake occurred. Base map from Raven Maps.
$12
62-9916
Each, rolled
Oregon Mineral Resources Map. 1:500,000. 1984. ODGMI (GMS-36).
$14.95
62-8940
1 sheet, folded
Oregon Mineral Deposits Map. 1:1,000,000. 1976. Mineral Research Co., NM. This three-color map illustrates 208 deposits and lists 67 references. Map size is 124 x 74 cm.
$14.95
62-8941
1 sheet, rolled
Mineral Resources Map, Offshore Oregon. 1:500,000. 1985. ODGMI (GMS-37). Companion map to 62-8940 and 62-8905 above. Map size is 149 x 100 cm.
$12.95
62-8945
1 sheet, folded
Oregon Geologic & Mineral Resources Quadrangle Maps. ODGMI.
$8.95
62-8957-CB
Camas Valley.
$8.95
62-8957-HB
Harper.
$8.95
62-8957-LI
Little Valley.
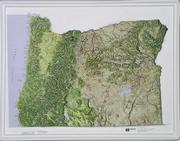
Oregon Satellite Image Map. 1:1,000,000. 1983. DOGAMI. This map, composed of Landsat images, illustrates the varied topography of the volcanic terrain of Oregon. Size 147 x 104 cm.
 Sample detail from the Oregon recreation atlas.

 Oregon map sample
 Image of the entire Oregon map
 Image of the entire reverse side of the Oregon map
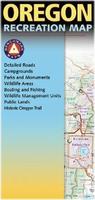
 Sample detail from the Oregon recreation map.

 Laminated
 Laminated
 Waterproof
 Sample detail from the Oregon waterproof road map.
 Image of the front of the Oregon waterproof road map.
 Image of the reverse the Oregon waterproof road map.
 Sample detail from Portland street map.
 Sample detail of the Pittmon Beaverton city map
 Sample detail of the Pittmon Bend city map
 Sample detail of the Pittmon Brookings city map
 Sample detail of the Pittmon Wheeler County map
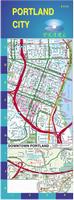 Laminated
 Sample detail of the Portland Pearl street map.
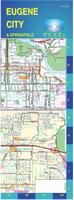 Laminated
 Sample detail of the Medford Pearl street map.
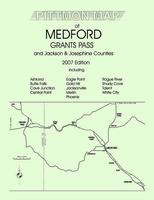
 Sample detail of the Pittmon Eugene street atlas
 Sample detail of the Pittmon Salem street atlas
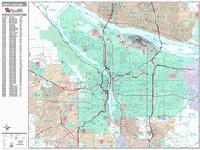
 Sample detail from the Portland wall map.
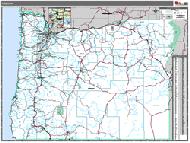 Oregon County and State Wall Maps.

 Oregon Raised Relief Maps.

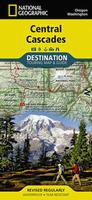
 Thumbnail image of the front of the Central Cascades map.
 Thumbnail image of the reverse of the Central Cascades map.
 Sample detail of the Central Cascades map.
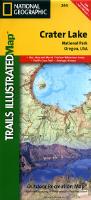 Waterproof!

 Image of the front of the map.
 Image of the detail of the map.
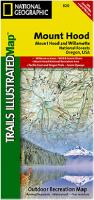
 Image of the front of the map.
 Image of the detail of the map.
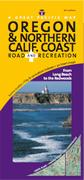 Recreation and road maps of Oregon. Great Pacific Recreation & Road Maps Co. GPR's up-to-date highly legible maps provide you with unmatched detail. Each map is cross-referenced to comprehensive easy-to-read text.
 Waterproof!
 Sample detail from the Bend Area Trail Map.
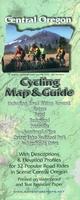 Waterproof!
 Sample detail from the Central Oregon Cycling Map.
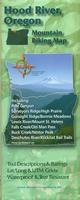 Waterproof!
 Sample detail from the Hood River Mountain Biking Map.
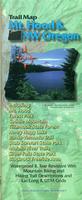 Waterproof!
 Sample detail from the Mt. Hood Trail Map.
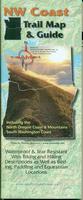 Waterproof!
 Sample detail from the Northwest Coast Trail Map.
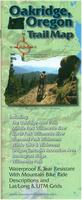 Waterproof!
 Sample detail from the Oakridge Trail Map.
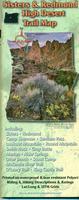 Waterproof!
 Sample detail from the Sisters and Redmond Trail Map.
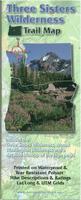 Waterproof!
 Sample detail from the Three Sisters Wilderness Trail Map.
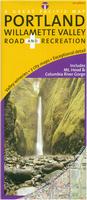
 Sample detail of the Portland and Willamette Valley Map
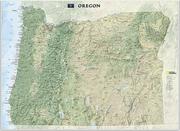 Oregon Wall Map. 1:1,185,000. National Geographic Maps.
 Sample detail of the Oregon wall map
 Image of the Oregon wall map
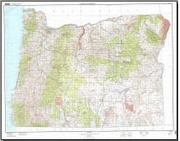 Oregon Topographic Map. 1:500,000. 1982. USGS. Map size is 140 x 112 cm.
 Sample detail of the Oregon topographic map
 Image of the Oregon topographic map
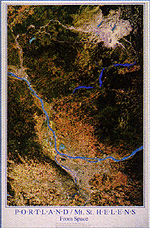


 Oregon Flags