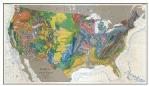
Geologic Map of the USA. 1:2,500,000. 1974. USGS. This map shows the geology of the United States in a detailed, attractive map that is a popular and useful addition to any classroom. This Geologic Map of the United States (exclusive of Alaska and Hawaii) is published at a scale of 1:2,500,000, and was compiled between 1967 and 1971 by Philip B. King and Helen M. Beikman, with geologic cartography by Gertrude J. Edmonston. Use this map for teaching and learning about the geology of the continental United States, and to explore the relationship between geology, minerals, population, and physical processes both past and present. The map is in two sheets with an accompanying legend.
Thumbnail of the entire map.
62-2000
3 sheets, rolled
$29.95
62-2000L
Laminated
$50.00
Earthquake and Seismicity Maps
Earthquakes in the Conterminous United State: 1534-1991. USGS. More than 35,000 earthquakes that have occurred in or near the conterminous United States are displayed on this colorful wall map (57 x 38").
The epicenter symbol sizes are scaled into four magnitude categories: magnitudes less than 4.0, magnitudes 4.0-4.9, magnitudes 5.0-5.9, and magnitudes 6.0 and greater.
Sixty-three notable earthquakes are identified and described in a table on the map. Base map from Raven Maps.
62-2019
Each, rolled
$17.95
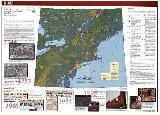
Earthquakes in and near the northeastern United States, 1638-1998. USGS, 2000. Map showing earthquakes across the northeastern USA and southeastern Canada from 1638 to 1998 on a shaded relief base with historical articles, drawings, and photographs. Click here for map web site. Use this map to teach and learn about earthquakes in the region, and their relationship to cultural and physical geographic features. This map is also excellent for breaking down stereotypes that "earthquakes can?t occur here."
Thumbnail image
62-20194
Each, rolled
$10.95
Central United States Earthquakes. 1:1,000,000. USGS, 1991. This map (35.5 x 26") displays earthquakes that have occurred in the central United States during 1974-1991.
The epicenters are shown on a map base obtained from Landsat satellite imagery of the New Madrid Seismic Zone and environs. The epicenter symbol sizes are
scaled into four magnitude categories: magnitudes 1.5-2.0, magnitudes 2.0-3.0, magnitudes 3.0-4.0, and magnitudes greater than 4.0.
62-20193
Each, rolled
$10.95
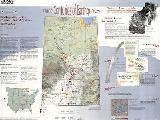
Earthquakes in the Central United States: 1699-2002. 1:1,250,000. USGS, 2003. This map (43.x57.) shows that central States, including Arkansas, Tennessee, Missouri, Kentucky and Indiana are among the most seismically active states east of the Rocky Mountains. More than 800 earthquakes are shown on the map, which displays the locations of earthquakes large enough to be felt since 1699. The large-format colored map identifies the infamous New Madrid earthquakes of 1811 and 1812, which by today.s standards would have been disastrous temblors with magnitudes around 7.7. The map also shows many smaller, but still destructive earthquakes including a magnitude 6.3 earthquake that shook eastern Arkansas in January of 1843; a magnitude 6.6 earthquake that shook residents of six states on Halloween morning in 1895 and was centered in southeastern Missouri; and a magnitude 5.4 earthquake that cracked foundations and toppled tombstones in southeastern Illinois in November of 1968. Explanatory text, newspaper headlines, and illustrative graphics surround the map.
Thumbnail image
62-20195
Each, rolled
$10.95
Major Earthquakes of the Pacific Northwest. USGS. This map (27 x 18") depicts selected epicenters of strong earthquakes (magnitudes >5.1) that have occurred in the Pacific Northwest. These earthquakes are the result of relative plate motions in the region.
The oceanic Juan de Fuca plate is slowly sliding beneath the continental North American plate at a rate of approximately 4 cm. per year. Base map from Unique Media.
62-20192
Each, rolled
$13.95
General Reference & Geo-thematic Maps of the USA
General Reference Map of the 50 States and the USA. 1:4,000,000. USGS, 2001. The National Atlas of the United States now offers a second General Reference Map which allows us the space to include all 50 states at a common scale of 1:5,000,000. Use this map to appreciate Alaska?s tremendous size and expanse. This map can also be used to teach and learn about America?s rivers, lakes, and islands; its high and low elevations; and each State?s area and population.
62-2045
1 sheet, rolled
$14.99
USA, Alaska and Hawaii Region Magnetic Anomaly Map. 1:2,500,000. 1984. USGS (GP-954B). Two sheets in color with 8-page text. Accompanies map 62-2015 above.
62-2016
2 sheets, rolled
$9.95
USA Bouguer Gravity Anomaly Map. 1:7,500,000. 1982. USGS (GP-953A). Two sheets in black and white show residual and regional Bouguer gravity in the conterminous USA. Map size 74 x 201 cm.
62-2018
2 sheets, rolled
$9.95
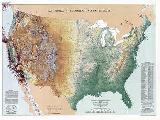
USA Forest Cover map. USGS. 1:7,500,000. 2000. Use this map of USA forest cover to teach and learn about the extent of forest land, the type of forest land, and the relationship of forest lan to other land cover types, to elevation, to latitude, to climate, and to population distribution. Map size is 32 x 28."
Image of the entire map
 Thumbnail of the entire map.

 Thumbnail image
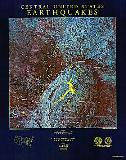

 Thumbnail image
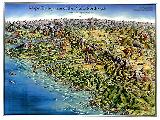

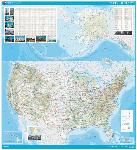

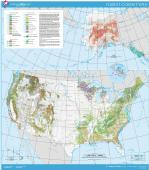
 Image of the entire map